

01.01.2019
30 minutes of reading


Oil prices fluctuated between $50/bbl and $86/bbl in 2018 for an average of $71/bbl, up 31% from 2017. The instability observed in 2018 was largely due to uncertainties about supply and economic growth, but also to US sanctions against Iran. Initially announced as extremely harsh, the embargo was in fact relaxed in extremis by the American president in response to the consequences envisaged on the rise in the price of oil products. This will be a theme to be followed again in 2019 as the exemptions granted to some countries will be reviewed in April. Other parameters will be a cause of instability, in particular the global economic and financial context faltering at the end of 2018, supply management by OPEP with the support of Russia and the relatively strong growth of American production.
Recurrent instability in the oil market since 2007
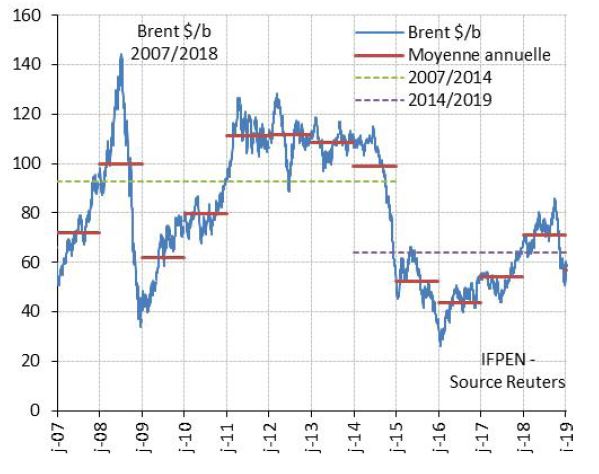
In 2018, the oil market was marked by a significant difference in oil prices of almost $40/bbl between the minimum of $50/bbl reached at the end of the year and the maximum of $86/bbl on 3 October of last year. These successive increases and decreases have been recurrent since 2017 (Figure 1), reflecting the supply/demand balance and uncertain expectations of the economic or geopolitical context. The oil price over this period thus includes the economic crisis of 2008, the Arab Spring in 2011, the rise of shale oil in the United States, the embargo on Iran last November and more recently fears of a global economic slowdown.
The causes of instability in 2018 and early 2019
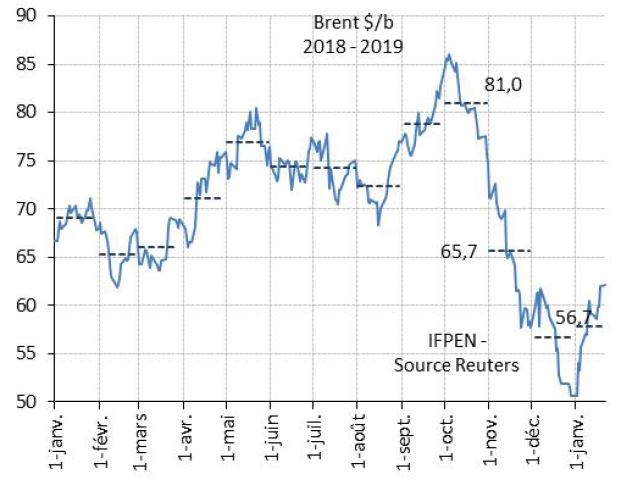
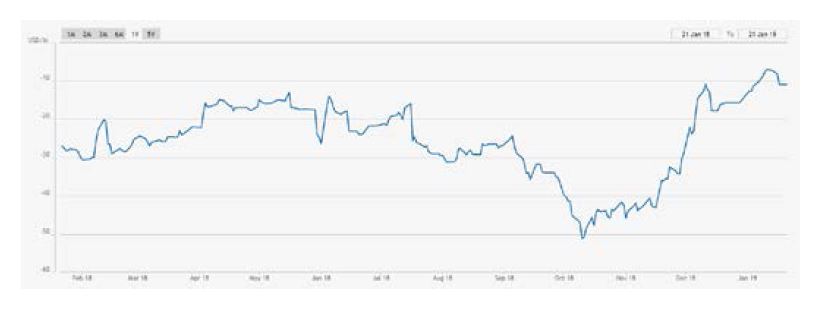
The Brent price averaged $71/bbl in 2018, significantly higher than the average prices recorded from 2015 to 2017 ($44 to 54/bbl) but well below the $100-110/bbl achieved between 2011 and 2014. The average for 2018 masks large variations (Figure 2) that can be divided into six phases:
- a stabilization phase in the first quarter between $65 and 70/bbl under the effect of the OPEP supply management policy decided in 2016 and applied since January 2017;
- a phase of supply concern in the second quarter due to uncontrolled production declines in some countries, including Venezuela and Libya, and the announcement by the Americans of a tough embargo against Iran;
- a relaxation phase in the third quarter thanks to OPEP's decision on 23 June to strengthen its supply;
- a resurgence of concern about the supply in September in the run-up to the sanctions against Iran, which came into force last November;
- a spectacular drop in prices after 3 October due to the effect of the turnaround in financial markets, the flexibility on the Iranian embargo finally decided by the US government and the increase in US oil production;
- a fragile rebound at the beginning of 2019 under the effect of a once again more optimistic vision of the economic context with the prospect of progress in the Chinese-American negotiations to resolve the trade "war" between the two countries.
The price trajectory in 2018 was a surprise even if the overall increase in the average price was anticipated at the end of 2017. For 2019, many parameters are likely to influence the price. It is possible to identify at least four of them:
- the evolution of financial markets and the economic context;
- the modalities for the implementation of the embargo on Iran;
- the OPEP/non-OPEP supply management policy;
- the level of growth of American production.
Financial markets and economic context, causes of instability
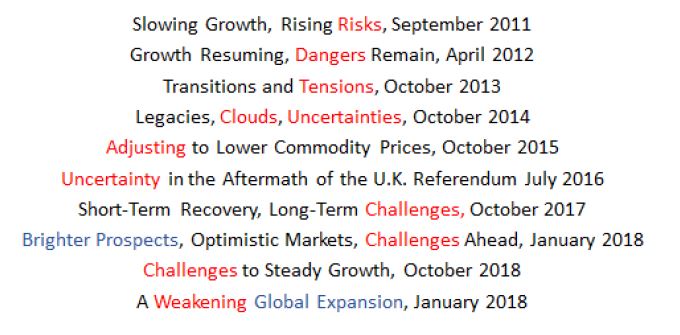
The financial and economic context remains subject to risk and uncertainty, as has been the case since 2011, according to the titles of the various reports published by the IMF since that date (Figure 3).
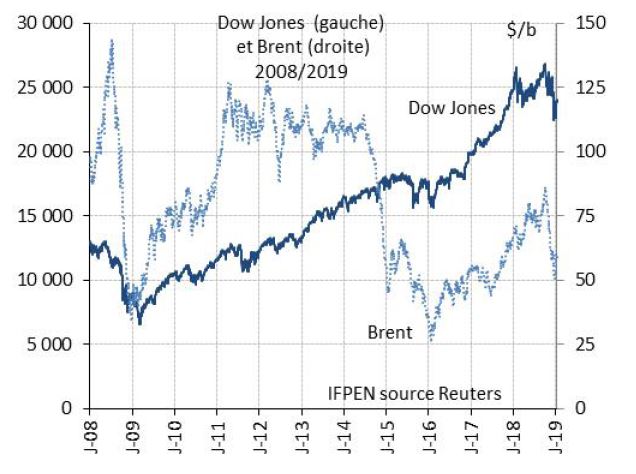
The end of 2018 was marked by a reversal of trust in global economic growth, leading to a decline in financial markets. Between the beginning of October and the end of 2018, the decline was around 14% for the Dow Jones (Figure 4) and the Euro Stoxx 50 and 26% for Shanghai. The Italian deficit, the United Kingdom's exit from the EU on 29 March with or without an agreement, Chinese-American trade tensions, rising interest rates in a context of high debt are all subjects of concern to the markets.
The impacts on the oil market are twofold. First, it is a purely financial impact with a repercussion of significant falls in financial markets on oil prices, as we have seen on several occasions in the past, particularly in 2008, 2015 and late 2018 (Figure 4).
The second impact concerns the potential variation in oil demand with the level of economic growth. Since 2011, annual demand growth has varied from 1 to 2 million barrels per day (mb/d) for a global annual economic growth rate of between 3.3% and 4.3% over this period (Figure 5), which is also marked by large variations in the Brent price ($45 to 120/bbl on average per year). This gives an idea of the extent of the possible corrections in 2019 compared to the 1.4 mb/d increase estimated by the IEA, for a global economic growth of 3.7% according to the IMF.
Varying degrees of stringency regarding the embargo on Iran
The American decision to re-establish an oil embargo on Iran was mentioned as early as 8 May 2018, the date of the withdrawal of the United States from the Iranian nuclear agreement. The US administration has regularly announced its intention to achieve a total halt in purchases of Iranian crude oil, which has contributed to the rise in prices since April 2018. But, faced with fears of a too sharp increase in the price of oil that would have impacted the price of petroleum products for the end consumer, it finally declined. It was also probably to avoid tensions with some Iranian oil-importing countries, which would have had difficulty in finding substitutes for these supplies. The American administration has therefore decided to relax its position.
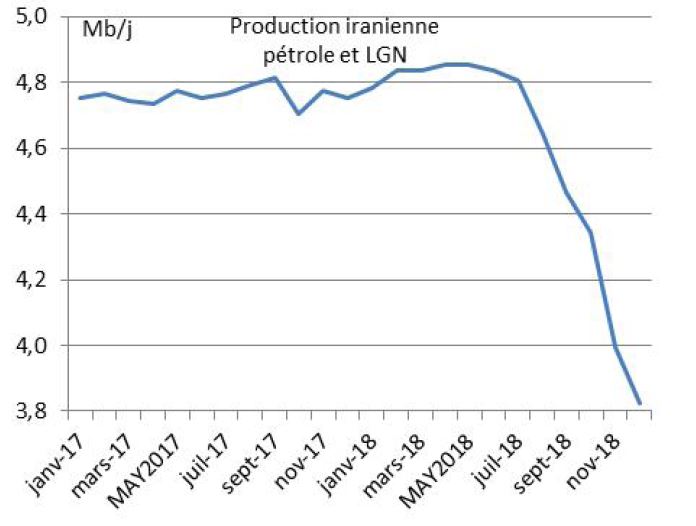
The United States has decided to grant waivers, over a six-month period, to China, India, South Korea, Taiwan, Greece, Italy and Turkey. On this basis, the decline in Iranian supply would be around 1 mb/d, a level close to that observed in November and December (Figure 6) and during the previous embargo on Iran (1.2 mb/d between 2010 and 2012). For the time being, therefore, these are relatively small volumes compared to the initial intention to stop all Iranian exports, an objective that would still be envisaged after the six-month transitional period.
This means that the actual level of decline in Iranian exports is not known with certainty over the coming months and especially after April. The maximum decline could theoretically cover a volume of around 2.7 mb/d, the average export volume recorded at the beginning of 2018. American statements on the subject will undoubtedly have a significant impact on the price.

The issue of compliance with the OPEP/non-OPEP supply management policy in 2019
The more conciliatory US decision on the oil embargo on Iran combined with the increase in US production has gradually accredited the idea of a possible oversupply. Faced with this risk, the OPEP/non-OPEP countries decided on 7 December 20182 to reduce their production in the first half of 2019 by 1.19 mb/d compared to October 2018.
The OPEP countries, except Libya, Venezuela and Iran, have committed to reducing their production by 0.81 mb/d. Saudi Arabia is expected to make the biggest effort with a 0.32 mb/d decline in production to around 10.3 mb/d in January from 10.6 mb/d in December. For the eleven non-OPEP countries, Russia announced a reduction of 0.23 mb/d compared to the 11.4 mb/d recorded in October 2018.
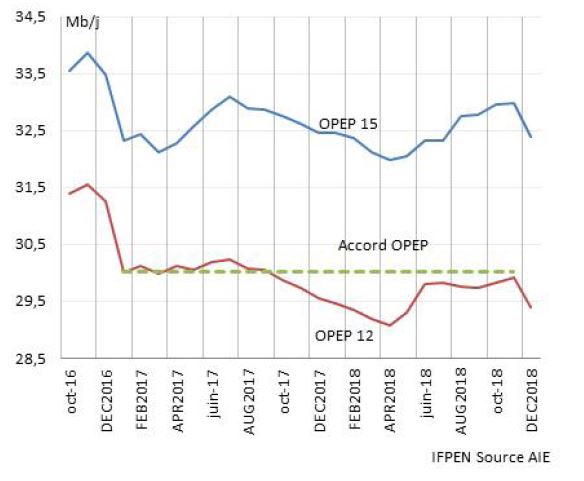
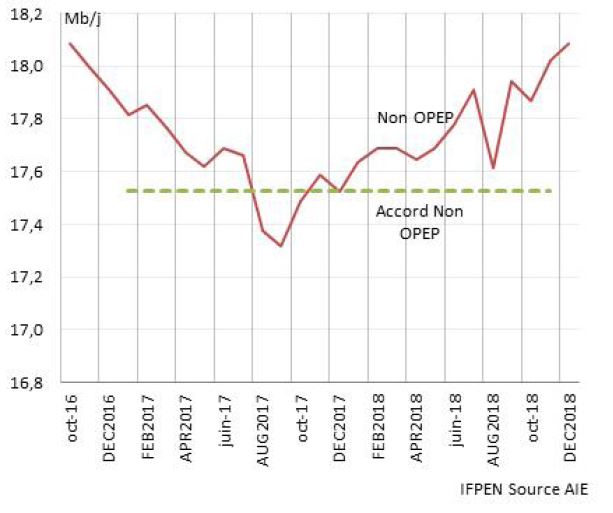
OPEP's overall production (+ Qatar) could therefore be 31.7 mb/d in 2019 compared to an average of 32.5 mb/d in 2018 and 32.9 mb/d in October 2018, the baseline month of the agreement. For non-OPEP countries, it is estimated at 17.5 mb/d compared to 18 mb/d in October 2018. The question arises as to whether this agreement will be respected. The 2016 one was (Figures 7 & 8), suggesting that the December 2018 one could also be. The stakes are high for these producing countries: it is a question of avoiding a further fall in oil prices.
Growth in American liquid production: + 1.8 mb/d in 2019 or more?
The impressive increase in US oil and NGL3 production since 2011 has disrupted the global oil market, leading in particular to a collapse in prices in 2014. This is the result of the particular characteristics of shale oil, which offer the ability to adapt quickly to changes in oil prices or to various constraints (sand availability, pipeline transport capacities, borrowing and financing capacities, etc.).
This has the effect of creating great uncertainty about the annual production potential, which explains in large part the difficulty in predicting market equilibrium. As a result, the outlook for oil and NGL production in 2018 has been adjusted by more than 2 mb/d between January 2017 and December 2018 (Figure 9). These considerable differences, equivalent to about half of Iran's oil production, obviously change the perception of the equilibrium of the oil market over time, which is played to the nearest mb/d.
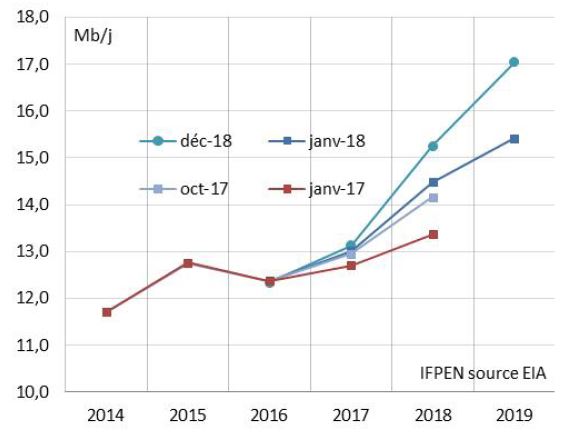
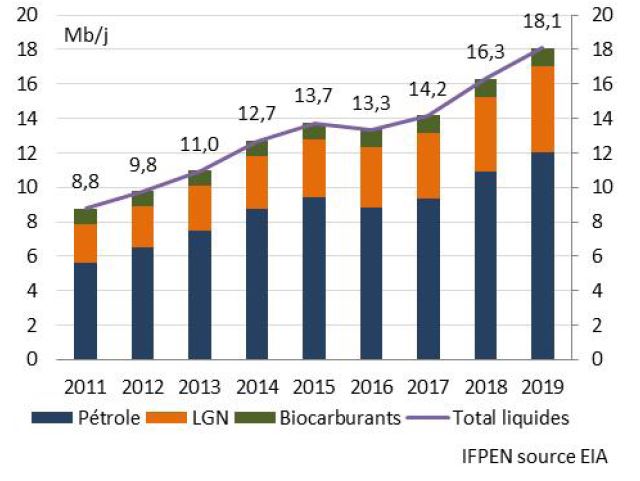
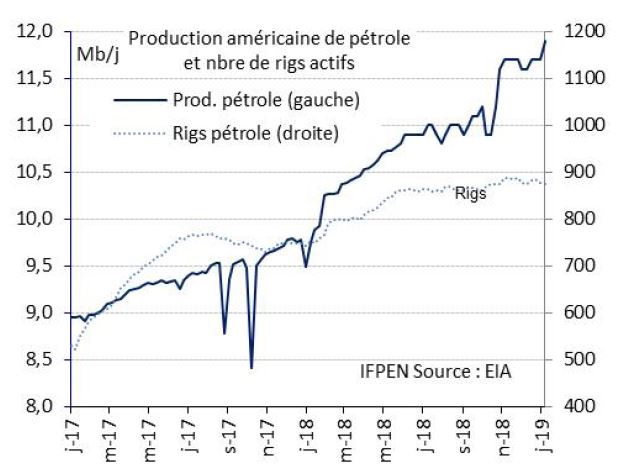
For 2019, the estimated growth compared to 2018 has increased in one year from 1 mb/d to 1.8 mb/d for the most recent ones. Overall liquid production is expected to reach 18 mb/d in 2019 (16.3 mb/d in 2018; figure 10) including 12 mb/d for oil including 9 mb/d from shale oil basins (7.3 mb/d in 2018).
But expectations about the volumes of shale oil produced are extremely uncertain, as we have seen in the past. Thus, depending on the assumptions used regarding drilling activity, which depends on oil prices, and the productivity of producing wells, production could, according to our models, be between 9 and 11.4 mb/d at the end of 2019 compared to 8 mb/d at the end of 2018 (Figure 11). This corresponds to an annual average growth rate of 1.5 to 2.2 mb/d.
By this time, a total of about 30 billion barrels (bb) will have been produced, compared to shale oil resources estimated by the IEA (World Energy Outlook 2018) at nearly 120 bb. This suggests that there is still significant production potential over the next three to five years. Beyond that, a beginning of stagnation or even decline cannot be ruled out on the basis of the resources known to date.
For 2019, the main challenge for the market is the effective growth rate of global American production, which is currently estimated at +1.8 mb/d by the EIA compared to 2.1 mb/d in 2018. The effective rate of growth of shale oil will play an important role in balancing the oil market.

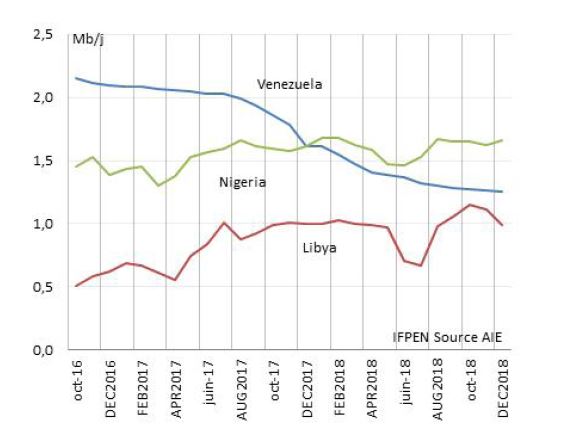
Price expectations between $60 and 80/bbl for 2019, reflecting uncertainties
The four uncertainties mentioned above do not reflect the full spectrum. In addition, there is the uncertain evolution of production in some countries, such as Libya, Nigeria or Venezuela (Figure 12). In Canada, too, in response to the decline in local quotation prices (WCS, Western Canadian Select), the government has asked operators to reduce their production by nearly 9% for at least six months, in the range of 0.3 to 0.4 mb/d. Finally, the oil market could be impacted by the implementation of new standards on marine diesel fuel by 2020, which could increase demand for low-sulphur oil.
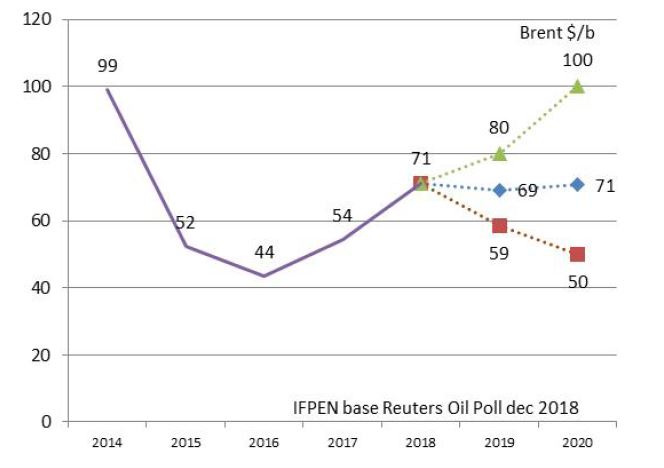
On this basis, Brent price expectations are between $60 and 80/bbl for the average in 2019 (Figure 13). They reflect the various possible scenarios concerning, in particular, economic growth, the embargo on Iran, supply management by OPEP or American production. It is difficult to sketch out an established truth in such a shifting context. This situation instils the idea of potentially chronic price instability, a cause of caution for exploration / production investment decisions. This raises the issue of a possible shortage of supply in the long term leading to a possible oil crisis in the coming years.
Guy Maisonnier - guy.maisonnier@ifpen.fr
Manuscript submitted in January 2019
APPENDIX 1: PETROLEUM PRODUCT PRICES IN FRANCE IN 2018
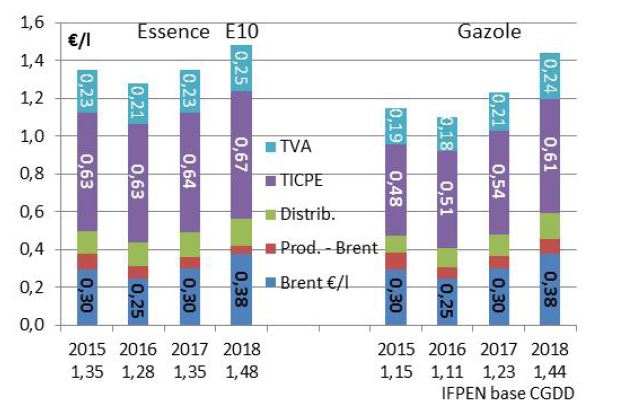
The average annual prices of petrol (E10) and diesel fuel increased by €0.13 /l and €0.21 /l respectively between 2017 and 2018 (Figure 14), which break down as follows:
- €0.08 /l are linked to the increase in the price of oil;
- The tax (TICPE) increased by €0.03 and 0.07 /l respectively;
- VAT increased by €0.02 and €0.03 /l respectively.
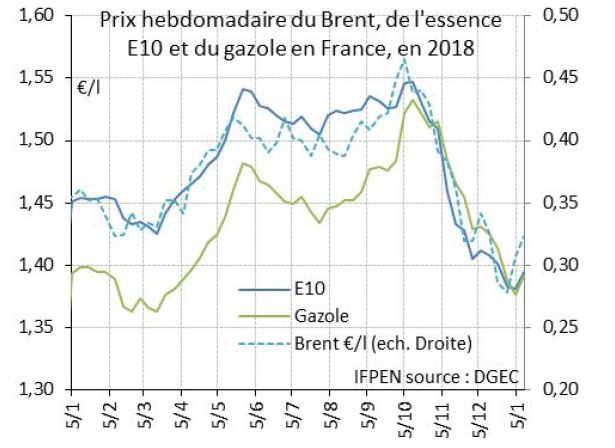
The breakdown for 2018 based on weekly prices highlights the sharp rise in the prices of E10 petrol and diesel from April and again in September, in line with oil price trends (Figure 15). From the beginning of October, the price of gasoline on the European markets fell sharply (Figure 19) due to the abundance of the product on the market. Diesel fuel, a product imported into Europe, has not experienced the same decline.
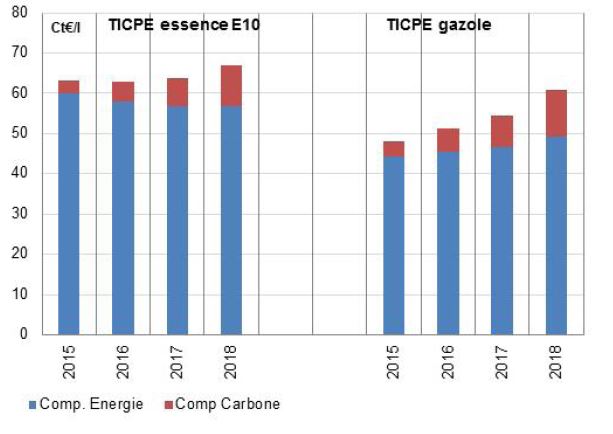
This explains the approximation of petrol and diesel prices at the pump since the beginning of last October, a phenomenon that, in 2018, is not linked to tax developments. This is therefore independent of the convergence of taxes between petrol and diesel initiated since 2014, which is mainly done through the energy component of tax (Figure 16). The carbon component, applicable for these two products since 2014, is now calculated on the basis of a CO2 price of €44.6/t (2018 and 2019 rates), equivalent to €0.101 /l for gasoline and €0.116 /l for diesel.
APPENDIX 2: $60 OR 80/BBL, WHAT ARE THE IMPACTS IN FRANCE?
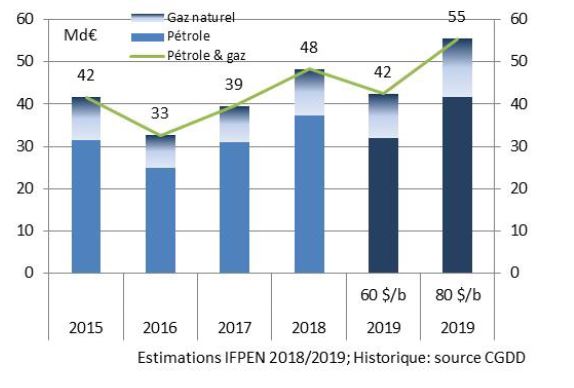
On the basis of the two price levels considered ($60 or 80/bbl in 2019 compared to $71/bbl in 2018), the French oil and gas bill would be between €42 and 55 billion (estimate; Figure 17). Compared to the amount of €48 billion in 2018, this represents a €6 billion gain in consumer purchasing power or, on the contrary, an additional cost of €7 billion. It is therefore an important issue in limiting or not the pressure on consumer spending on petroleum products.
In both cases, the bill would remain higher than in 2016 (€33 billion) and 2017 (€39 billion). It is worth remembering that 2016, which was an exceptional year, recorded an oil price of less than $45/bbl, as a result of the oil market surpluses linked to the influx of shale oil. The very significant increase in the amount of the invoice between 2016 and 2018, amounting to €15 billion, represents around 0.6% of national GDP. This upward trend, linked to the price of oil, contributed to the perception of a very significant burden on household energy expenditure in 2018.
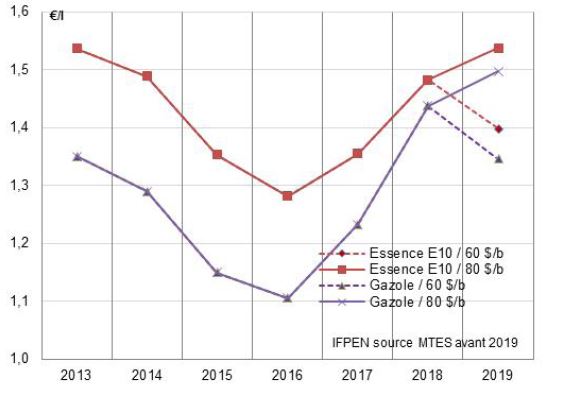
As for the selling prices in France of petrol and diesel (Figure 18), they would fall, compared to the 2018 average, by around €0.08 to 0.09/l for an oil price of $60/bbl to reach €1,40 /l and €1,35 /l respectively. On the other hand, for a price of $80/bbl, they would increase by about €0.06 /l to €1,54 /l and €1,50 /l respectively. These estimates take into account the stability of the TICPE tax (domestic consumption tax on energy products) at the level defined in 2018.
Note: It should be noted that these expectations take into account the average differences in the price of petroleum products compared to Brent on European markets in 2018. These quotations were particularly disrupted at the end of the year with a premium on diesel and on the contrary a discount for petrol (Figure 19). These cyclical or structural disruptions (navigation problems on the Rhine, trade balance of petroleum products in the United States, etc.) are difficult to anticipate. Nevertheless, they play a fairly sensitive role in the price for the final consumer. It will therefore be necessary to be vigilant about the impact of the new standards on marine diesel fuel introduced in 2020. This could have an upward impact on the price of diesel fuel as early as this year.

APPENDIX 3: IMPACTS ON NATURAL GAS PRICES IN EUROPE
The formation of the market price of gas in Europe is no longer the only result of formulas based on the price of petroleum products. Market prices (spot prices) now account for 70% of trade in Europe, with the remainder being defined on the basis of traditional contracts dependent on oil prices.
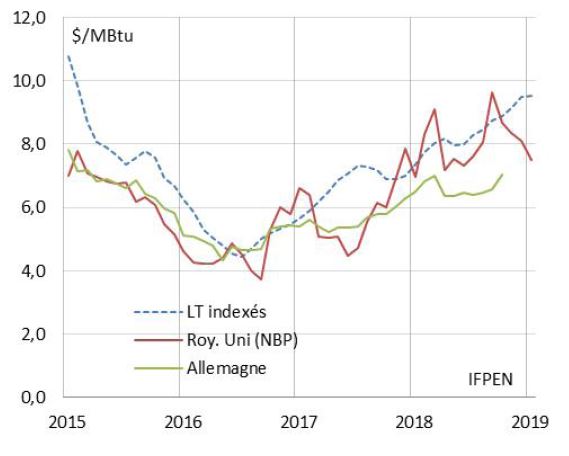
Nevertheless, there is still a fairly important link between the price of oil and the price of gas. This is what can be seen in the developments since 2015 (Figure 20). The gas price of indexed contracts defines the high threshold of market prices, which is usually reached in winter or even exceeded in periods of high demand. In the summer, the market price is generally lower than this reference price. Overall, the market price therefore follows the price trends of contracts indexed to the oil price, sometimes with a discount or, on the contrary, a premium depending on the supply/demand balance.
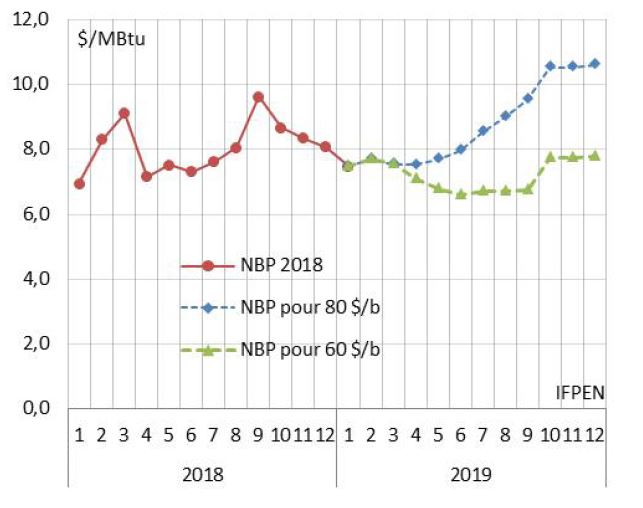
In this context, the average gas price in Europe could be as high as $7/MBtu (€21 /MWh) for an oil price of $60/bbl compared to nearly $9/MBtu (€26 /MWh) at $80/bbl (Figure 21). This is respectively a decrease of 9% or an increase of 12% compared to the average level of 2018 ($8 /MBtu or €23 /MWh).
APPENDIX 4: RECENT EVENTS
Economics
- 21 January: the IMF is lowering its forecast for global economic growth, which is now estimated at 3.5% in 2019 and 3.6% in 2020 compared to 3.7% in 2018. The IMF uses an oil price of less than $60/bbl for 2019 and 2020 compared to $69/bbl and $66/bbl in its October projections. These are not forecasts but the average of forward prices on 27 November. These prices, which are very dependent on the context, have since risen ($62/bbl for Brent).
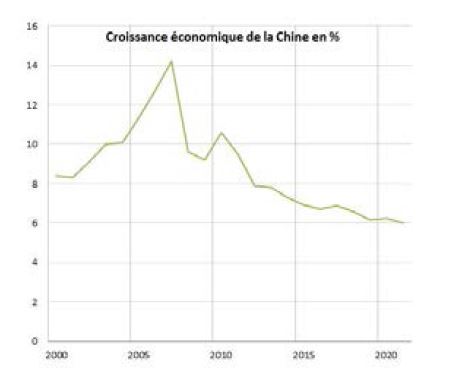
- January: concern about the slowdown in China's economic growth. This phenomenon has been established since 2010, however, due to a trend of "linear" growth. The standard of living, measured by GDP per capita, continues to increase.
OPEP
- 21 January: Russia, through the Minister of Energy, indicates its willingness to reduce its production.
- 18 January: OPEP publishes the distribution by country of the drop in production following the OPEP/non-OPEP agreement in December. The reduction is set at 1.195 mb/d, including 0.812 mb/d for OPEP countries and 0.383 mb/d for non-OPEP countries. The largest decreases were in Saudi Arabia (0.322 mb/d), Russia (0.230 mb/d) and Iraq (0.141 mb/d).
- 17 January: the first OPEP production statistics for December show a significant drop in production of 0.6 mb/d, a drop that must however be put into perspective. This is explained by the record level of production in November at 33 mb/d, including 11 mb/d for Saudi Arabia. December's production thus remains above the objectives set for the first half of the year.
Iran
- 21 January: “After China, South Korea, India and Turkey, Japan has also begun to import Iranian oil," said the Governor of the Central Bank of Iran. These imports are possible thanks to the exemptions granted by the United States until next April. However, the US administration, which still wants to reduce Iranian exports as much as possible, seems to want to define its strategy for the following months according to the context of the oil market.
Venezuela
- 29 January: The US administration imposes sanctions on the Venezuelan oil company PDVSA. The sanctions are aimed at freezing, in a blocked account, the amounts resulting from exports to the United States (0.5 mb/d, i. e. $11 billion/year to $60/bbl). The American refiner Citgo Petroleum, a subsidiary of PDVSA, will be able to continue to operate in the United States provided that its revenues are paid into an escrow account.
- US exports of thinners, used for heavy oils from Venezuela, are also prohibited. American companies operating in Venezuela (Chevron Corp, Halliburton, Schlumberger, Baker Hughes, Weatherford International) are allowed to operate until 27 July (possible impact on Venezuela's production).
- 17 January: the US Administration refers to the possibility of establishing new sanctions against Venezuela, in particular on oil imports, which could disrupt some US refiners.
United States
- 17 January: the latest statistics show a further increase in US oil production, which is approaching 12 mb/d. Since the beginning of 2017, the 3 mb/d increase has been equivalent to Iran's current oil production.
Canada
- January: the discount of the WCS, the price reference for Canadian heavy crude oil, compared to the American WTI has been between $15 and 7/bbl since mid-December, compared with more than $40/bbl between October and November. This is the result of the production reduction decided in December by the Alberta government.
Others
- January: IRENA publishes a report on "The Geopolitics of the Energy Transformation". “The influence of some states, such as China, will grow because they have invested heavily in renewable technologies and built up their capacity to take advantage of the opportunities they create. By contrast, states that rely heavily on fossil fuel exports and do not adapt to the energy transition will face risks and lose influence.”
[1] NGL: Natural gas liquids, i.e. petroleum products produced at the same time as natural gas.
[2] During this meeting, Qatar announced its withdrawal from the organization effective from 1 January 2019
[3] NGL: Natural gas liquids, i.e. petroleum products produced at the same time as natural gas.